DataFest Tbilisi 2025 : data art workshop about how it transforms strategic decisions
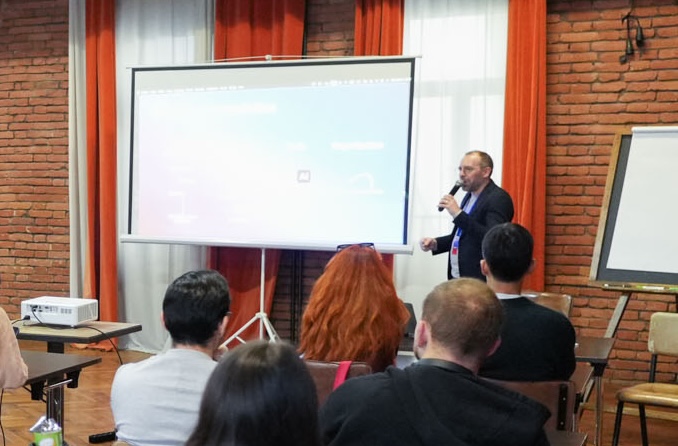
In November 2025, I ran a 90-minute data art workshop at DataFest Tbilisi for around thirty data and analytics professionals. The premise was simple: data art is not a decoration practice. It is a decision-making tool — and one that most organizations are dramatically underusing. The problem I wanted to address with this data art workshop We produce more data every two years than in all of human history before that. Less than 2% of it gets properly analyzed or used. Meanwhile, dashboards multiply, attention decreases and decision-makers struggle to decide.In analytics, we all build reports and dashboards and work hard on…
Comments Off on DataFest Tbilisi 2025 : data art workshop about how it transforms strategic decisions
22 April 2026