Why I Chose This Subject
I went to Estonia during my Erasmus program in 2005, and I found my heart country there—a place I return to at least once or twice a year. Generally speaking, everything related to Estonia interests me, and what better way to know a country than to discover its history? In France, we learn little about the history of this part of Europe, even though it’s very complex and difficult to grasp compared to our own.
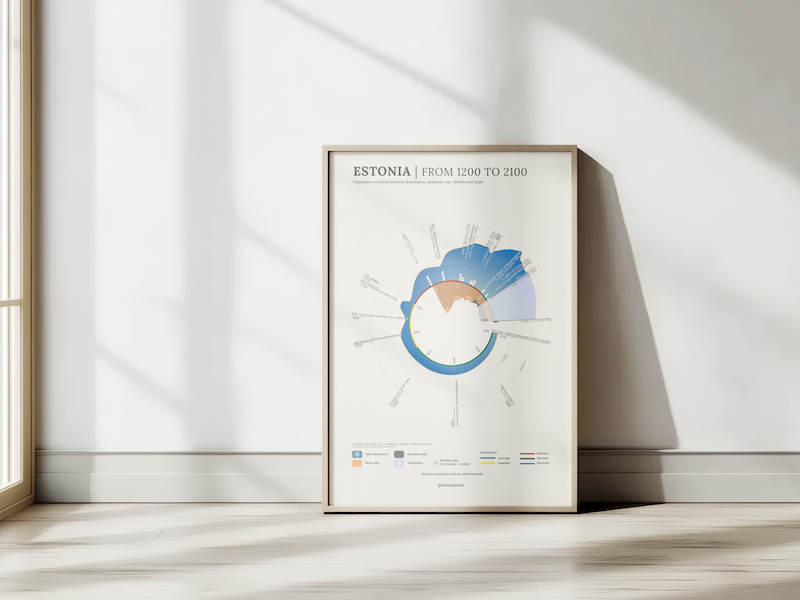
Through the lens of population numbers and their evolution across centuries, I decided to trace Estonia’s history through a graph that illustrates major events : Estonian population data visualization
Estonian population data visualization In a Few Words
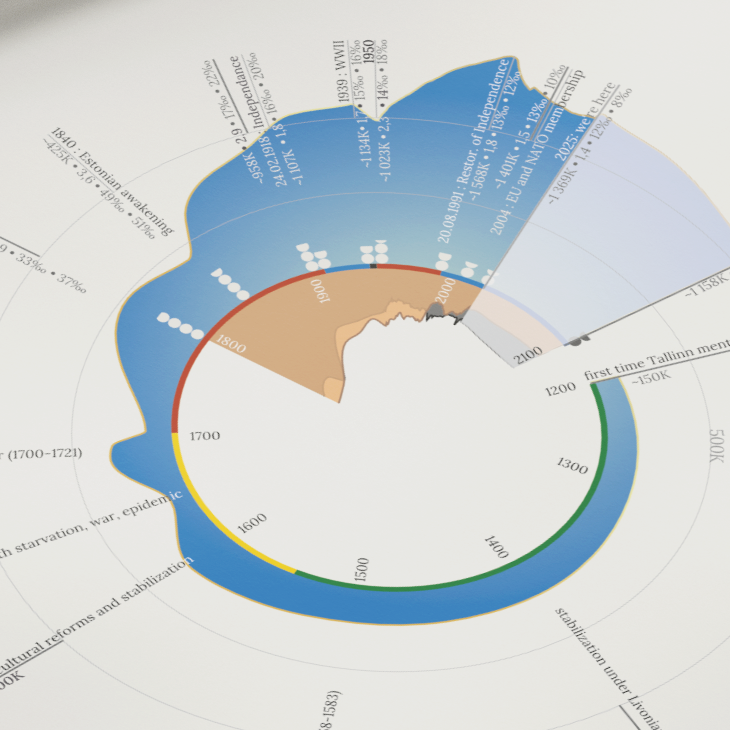
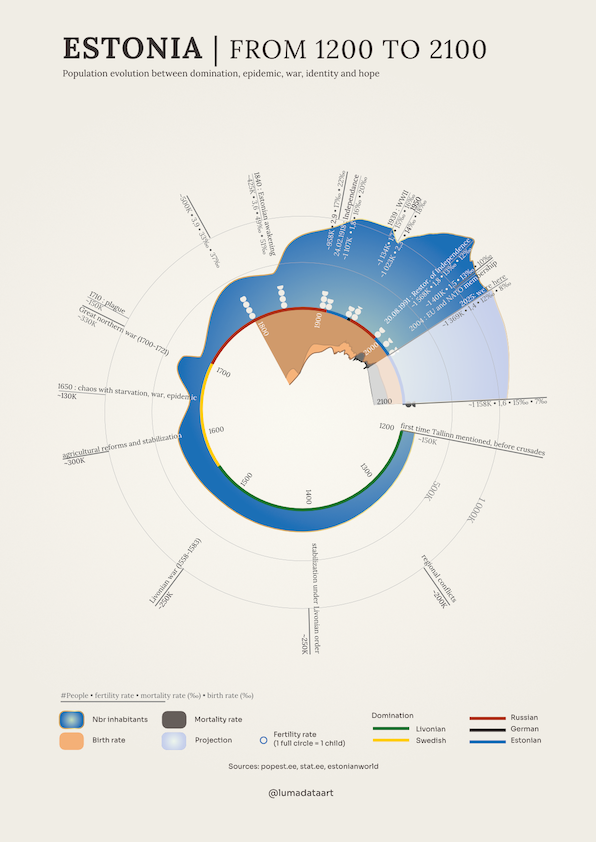
Estonia obviously existed before 1200 AD, but that’s when it was first documented. At that point, it was divided and had approximately 150,000 inhabitants. Until nearly 1600, it was under Livonian rule and subject to numerous conflicts.
It then came under Swedish rule. Agrarian reforms, advances in harvesting technologies, and stability led to the Estonian population exceeding 300,000 inhabitants. Unfortunately, demographics collapsed around 1650 due to famine, wars, and epidemics. Numerous migrations caused the population to rise again.
The Great Northern War of 1700 saw the Russians succeed the Swedes. Added to this was the plague, which decimated the population.
From 1800 onwards, Estonia had nearly 500,000 inhabitants. Birth rates, fertility rates, and mortality rates were very high but surprisingly close to those of Western European countries. In 1840, the National Awakening gave birth to an Estonian sentiment: language, books, and culture began to take root.
By 1900, the population approached one million. Fertility declined, but birth and mortality rates remained very close. February 24, 1918, is an important date as Estonia gained its independence. World War II arrived and reduced the number of inhabitants. The number of children per woman continued to drop, but birth and mortality rates remained close. Estonia came under Soviet rule, and the population continued to grow until independence in 1991. The population declined as many people left Estonia.
This stabilized in 2000, but one phenomenon became persistent: the mortality rate exceeded the birth rate, leading to demographic decline. Estonia joined the European Union, NATO, and adopted the Euro. Estonia took flight and bet on digitalization to compensate for weak infrastructure and limited resources. In this regard, I highly recommend the book “Demain, Tous Estoniens” by Violaine and Pierre.
Trends beyond 2025 show a continued decline in population until 2100. This is a fairly widespread phenomenon in Europe, and these are still only predictions, although there has been significant immigration since the Ukrainian conflict.
Estonian population data visualization Method and Sources
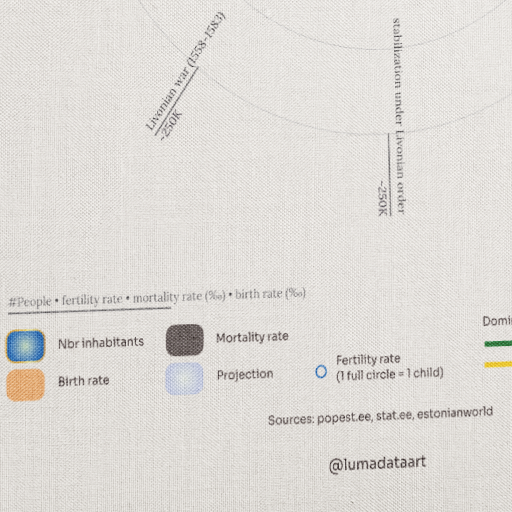
Estonian population datavisualization – It was difficult to find reliable data. I cross-referenced multiple sources—often in Estonian—to determine the population over the years.
From 1800 onwards, I was able to access reliable data concerning fertility, mortality, and birth rates.
A lot of research work but not necessarily a technical challenge. I used a spreadsheet and Illustrator to finalize the visual.
Besides books, I also used digital sources:
Conclusion: Learning History Through Data Art
Reading books is fascinating for capturing numerous details.
But it can be interesting to combine these readings with data art to have a global vision, major trends and events, while having the possibility to investigate a particular period.
This work was very long for me, sometimes discouraging given the difficulty of finding data—that’s where I spent most of my time. But I learned enormously, and I’m very proud to present this piece of data art that I hope will allow you to learn more about a country dear to my heart.
I’m currently working on several series of visualizations by theme on Estonia. More to come!
Here is the full Estonian population datavisualization by Lumadataart