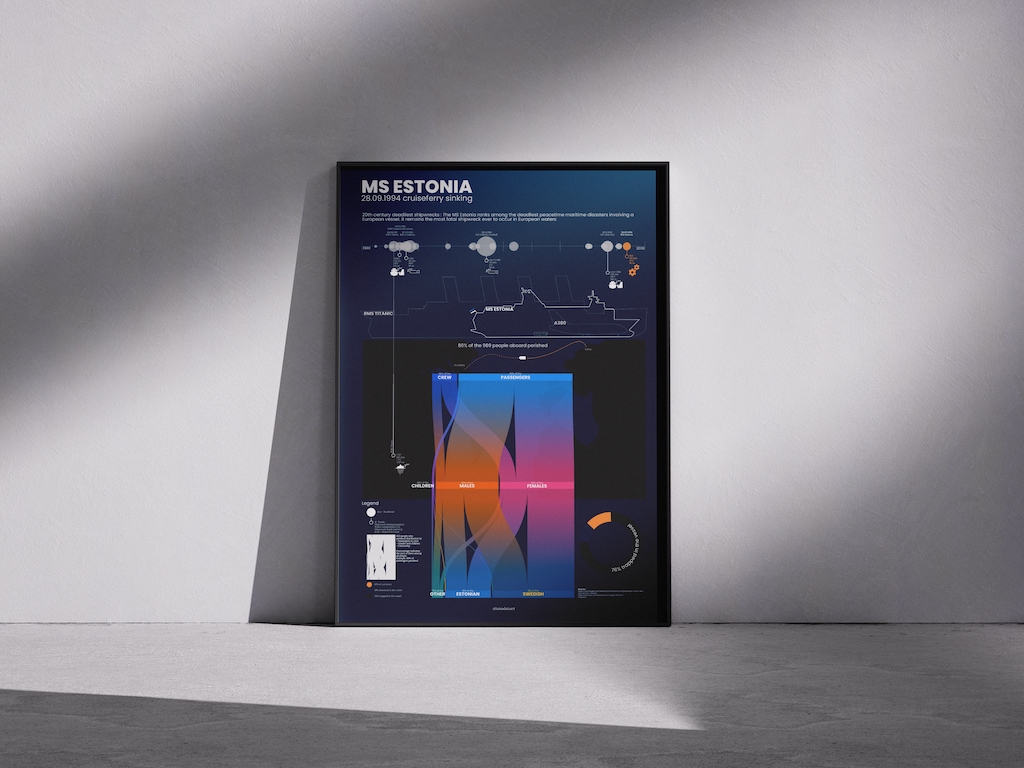
MS Estonia shipwreck datavisualized

Why I Chose This Subject Estonia has always been special to me. It’s my country of heart. So when I heard about the sinking of the MS Estonia, it stayed with me.I first learned about it during my Erasmus year in Tallinn in 2005. I was young when it happened in 1994. Too young to remember it being covered at the time. But in Tallinn, the memory was everywhere.When I decided to make a data art piece about this tragedy, I knew it had to be more than facts on a page. I wanted to ask questions: Which shipwrecks shaped the 20th…

0 Comments

Data Art in Business Management: Visualizing Team Activity

How can data art help leaders manage teams more effectively? 
I designed this visualization to demonstrate how data art brings value to business management. It may not replace daily dashboards, but it offers a strategic perspective for quarterly reviews or team retrospectives. This kind of visualization helps answer critical questions: How are resources, time, and energy being spent? Who are your main clients? Are your efforts aligned with the right accounts and priorities? These insights are fundamental, especially for B2B organizations where alignment with strategy is key. Why This Matters for Leaders As a manager, you need more than just operational numbers.…

Comments Off on Data Art in Business Management: Visualizing Team Activity

Fast & Furious series datavisualized

I discovered it in 2001 when the first movie was available in DVD. I enjoyed the cars, the characters, the friendship, Toretto’s bad ass band and the soundtrack (I listened it in loop while doing those datavisualizations). It was really cool and quite new compared to other cars movies. Year after year, I discovered new episodes while my life evolved. That's why I decided to create a datavisualization about the Fast & Furious movies.But how do they handle to make more than 10 movies about cars addict friends ? Movies evolved of course. But how ? Concretely, what is the difference between…

Comments Off on Fast & Furious series datavisualized

Data design to decide

Decisions are based on fact, emotions and guaranty a business success or failure.Among people knocking at your desk, emails, chat, phone calls, meetings, social networks… sollicitations are numerous and it’s tough to find the right set of information, digest and understand complex issues. Those noises don’t help to focus and decide. A decision contains a part of fact and a part of feelings. Always. Data design is here to reduce the noise and find the best way to display your data, facilitate your comprehension and get the information you need to make your decision. At least on the factual part. Let’s see…

Comments Off on Data design to decide