Here is my continously growing portfolio. My ambition is to inform and keep things visual. If you click on a picture, you will access an article explaining the project and the insights unveiled from it.
If you’d like to dig a topic thanks to data art, drop me a message and let’s talk about it !
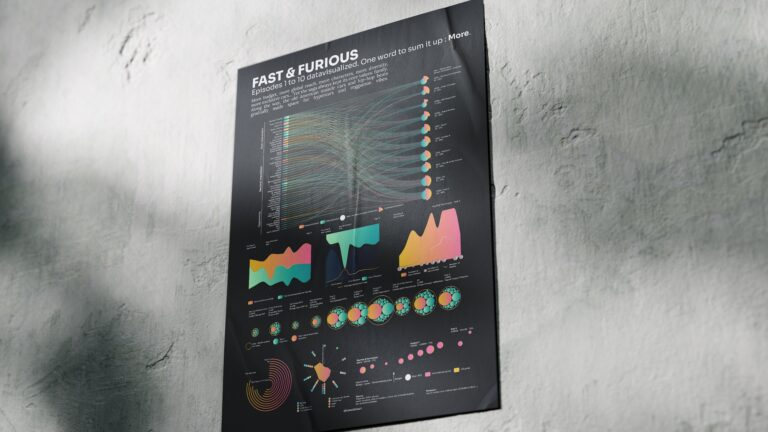
Fast & Furious series datavisualized
Some movie series follow you throughout your life. Fast & Furious is one of them for me. After 10 movies and just before the last episode closing the series, I decided to make a collection of datavisualization to analyse the saga evolution between 2001 and 2023 when Fast 10 was available at the cinema.
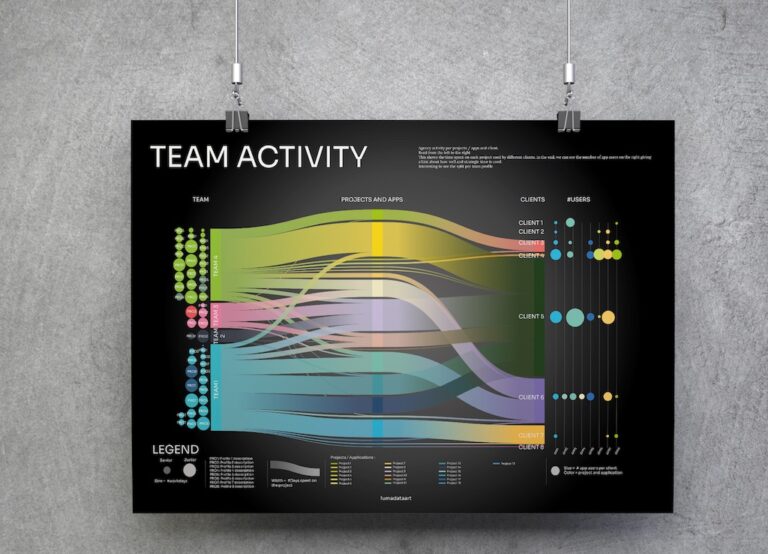
Team activity datavisualized
How can data art help leaders manage teams more effectively? I designed this visualization to demonstrate how data art brings value to business management. It may not replace daily dashboards, but it offers a strategic perspective for quarterly reviews or team retrospectives.
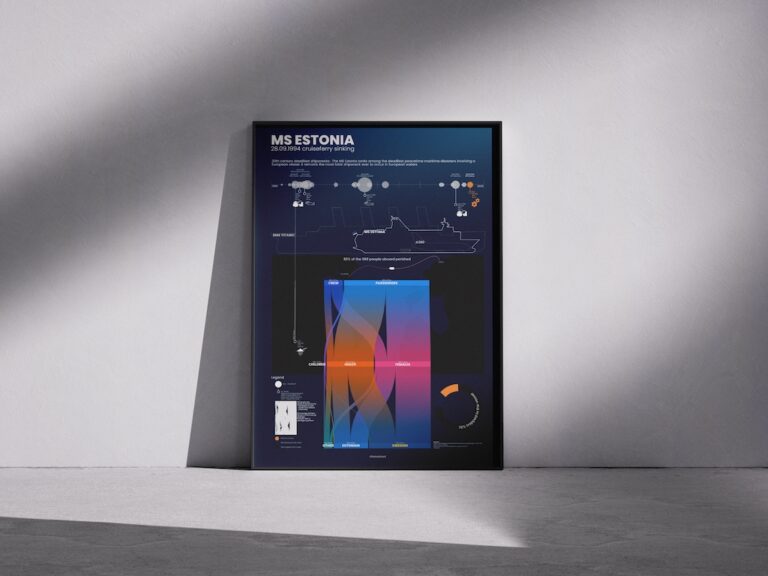
MS Estonia shipwreck datavisualized
This data art project offers a personal and visual exploration of the MS Estonia tragedy. On September 28, 1994, the ferry capsized between Estonia and Sweden. Nearly 90% of those on board died.
Many questions remain unanswered, but through data and design, this work tries to capture the essence of what happened — not only in numbers, but also in memory.
