Why I Chose This Subject
Estonia has always been special to me. It’s my country of heart. So when I heard about the sinking of the MS Estonia, it stayed with me.
I first learned about it during my Erasmus year in Tallinn in 2005. I was young when it happened in 1994. Too young to remember it being covered at the time. But in Tallinn, the memory was everywhere.
When I decided to make a data art piece about this tragedy, I knew it had to be more than facts on a page. I wanted to ask questions:
- Which shipwrecks shaped the 20th century, and how do they compare?
- How does the Estonia differ from the Titanic, or even an Airbus A380?
- What did the route from Tallinn to Stockholm really look like?
- Who were the victims? How did they die?
So many articles, documentaries (like the one realized by HBO) and forum discussions already exist. But I wanted to give it another form — to turn data into a story, into something visual and human. A way of remembering.
Shipwrecks of the 20th Century
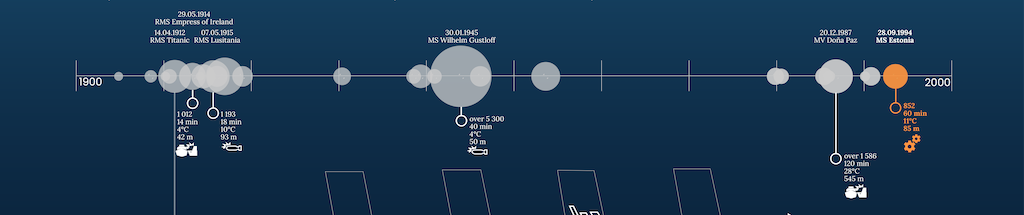
Before diving into the Estonia itself, I looked at other shipwrecks of the 20th century — the ones with more than 100 victims.
I’m not a maritime expert. Still, some patterns became clear. Many large accidents happened just after 1900. The Titanic, of course, is the one everyone remembers. But there were many others, especially during wartime.
To compare them, I collected a few simple but powerful indicators:
- How many people died?
- How long did the vessel take to sink?
- How cold was the water?
- How deep is the wreck today?
- What caused the disaster?
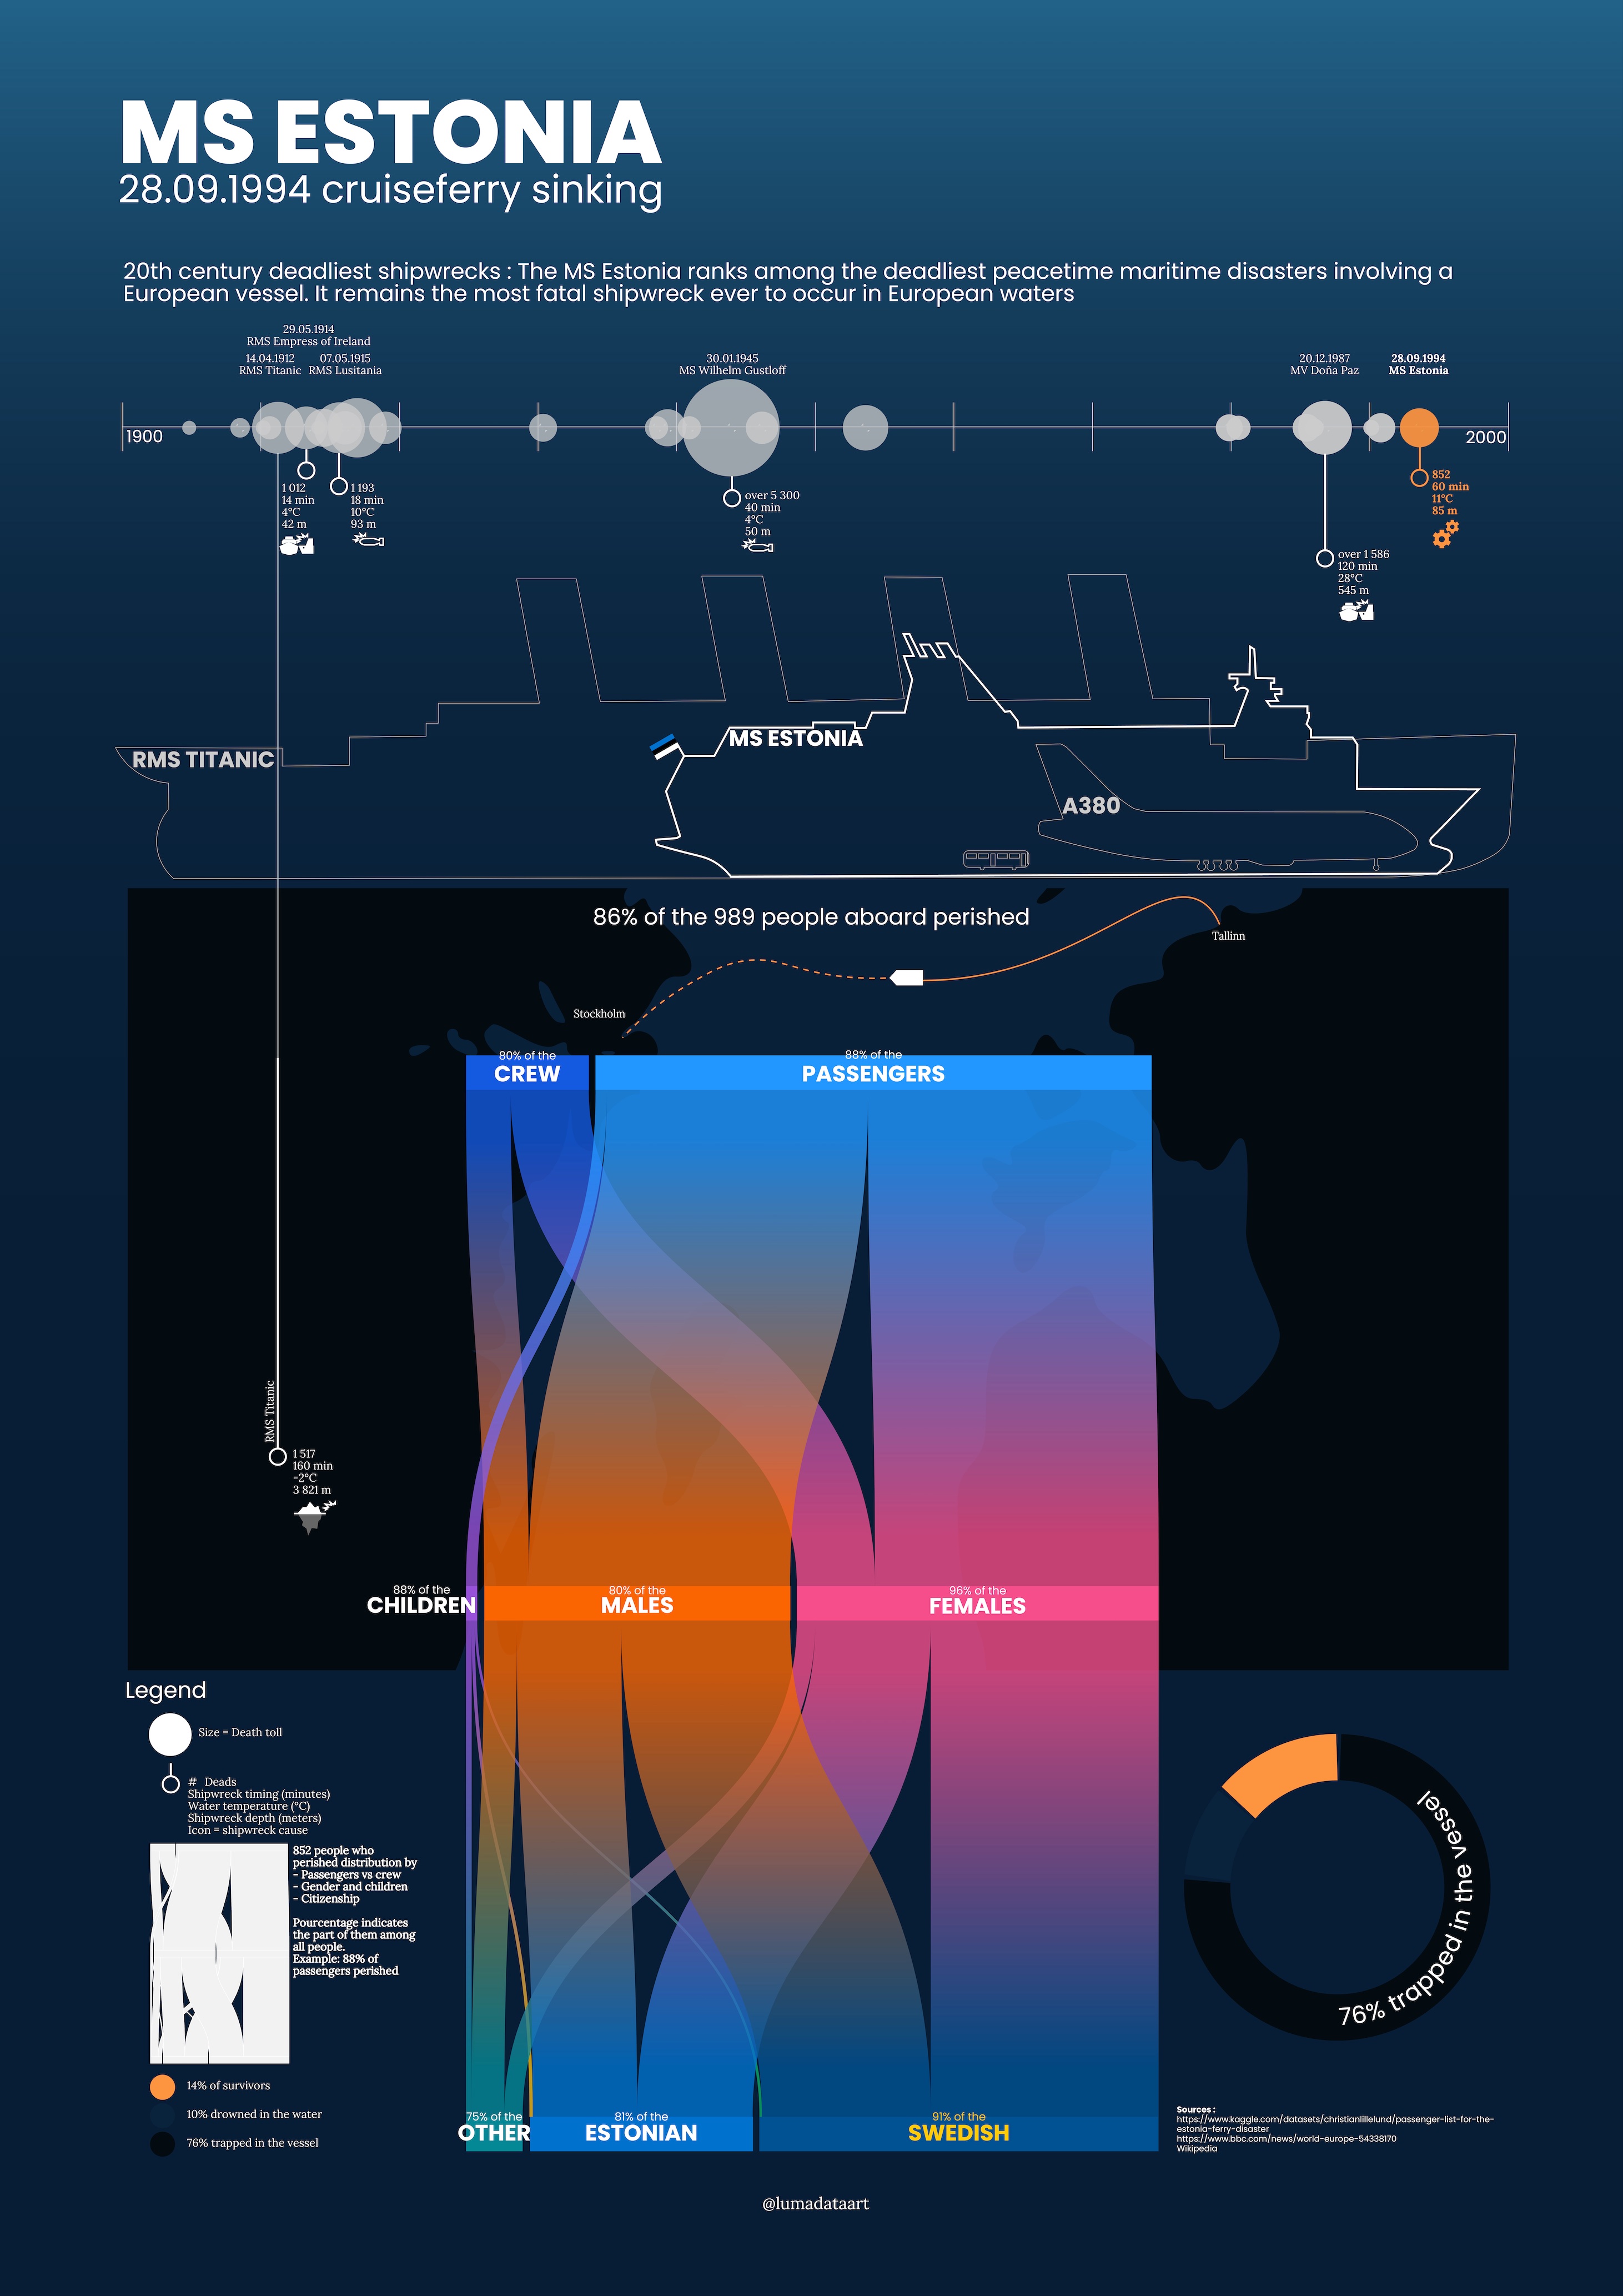
Placing these side by side creates a chilling picture. The Estonia lies at only 85 meters deep — far more accessible than the Titanic. But the conditions the night it sank were brutal: icy waters, a storm, and violent waves.
The MS Estonia in Scale
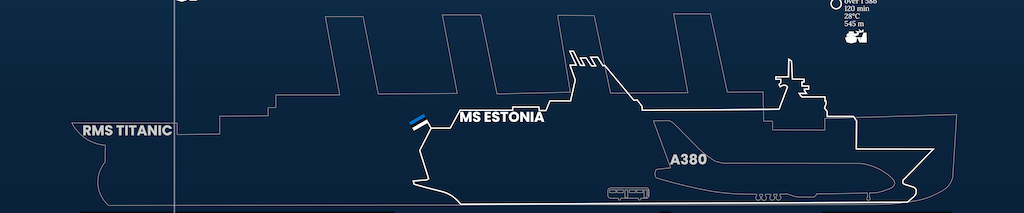
So what was the Estonia like? To understand its size, I compared it with other icons: an Airbus A380, a city bus, and of course, the Titanic.
The Estonia carried up to 2,000 passengers and 460 vehicles. It measured 157 meters in length, 24 meters wide, and weighed 15,000 tons.
By comparison, the Titanic was a giant: 269 meters long, 28 meters wide, 46,000 tons. And the A380 — our symbol of modern aviation — seems small next to these ships.
Numbers alone don’t capture it. But when visualized, the scale becomes almost physical.
The Final Journey to Stockholm

The Estonia left Tallinn on September 27, 1994, with 989 people on board.
It never arrived in Stockholm. The ferry capsized and sank in just 60 minutes, at 1:50 a.m., between Finland and the island of Saaremaa.
Most of those on board were Swedes and Estonians. Many Estonians formed part of the crew. For them, this was a routine crossing. It ended in Europe’s worst peacetime maritime disaster.
Almost 90% Perished: Data of a Tragedy
The official investigation pointed to the bow visor locks. They failed. The visor was torn away, and water poured in through the car deck.
The sequence was merciless:
- Middle of the night. Most passengers asleep in their cabins.
- A storm with six-meter waves.
- Freezing water everywhere.
- Within one hour, the Estonia was gone.
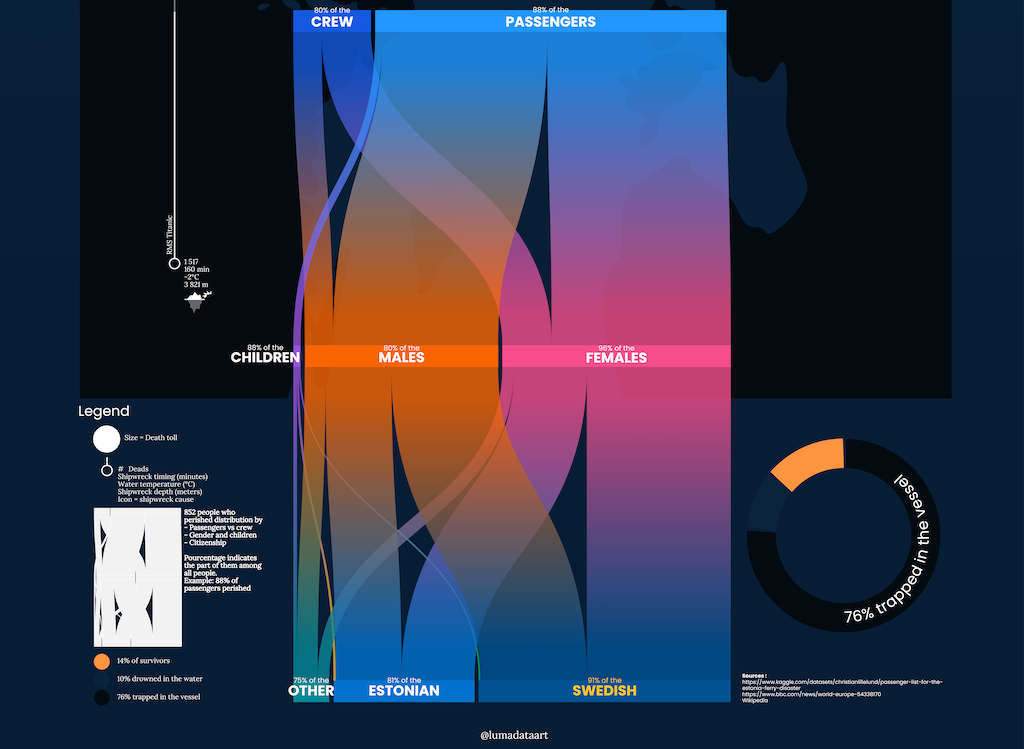
The survival numbers are devastating. 86% of those on board died. But not all groups were affected equally:
- Passengers suffered far more than crew.
- Women had the lowest survival rates — even lower than men and children.
- Swedes, mostly passengers and with a high share of women, were hit hardest.
- Other nationalities also suffered terrible losses: Latvians, Russians, Finns, Norwegians, Danes, Germans.
The causes of death tell their own story:
- 76% were trapped inside the wreck, now lying at 85 meters.
- 10% drowned in the sea.
- The survivors — very few — were pulled out, mostly by helicopters.
Statistics can feel cold. But behind each number was a life. A person.
Method and Sources
Working on this project was not easy. At times I felt chills, as if the cold waters of the Baltic reached me through the data.
For the Estonia passenger data, I relied on the Kaggle dataset. I analyzed it in Python.
For other shipwrecks, I spent hours digging through Wikipedia, survivor interviews, and press archives.
I then sketched the first prototypes, used Flourish for interactive views, and finished the visualizations in Illustrator.
Even the process felt like a journey — from raw numbers to a form of memory.
Conclusion: Remembering Through Data Art
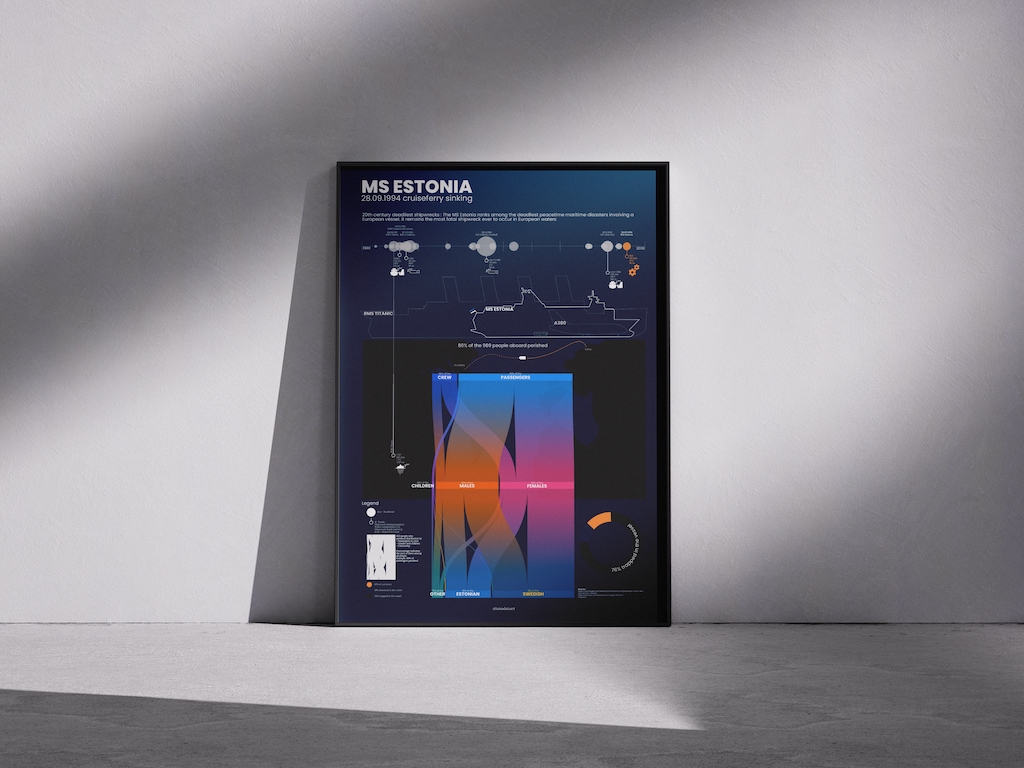
The Estonia disaster remains the deadliest ferry tragedy in Europe during peacetime. Nearly 90% of those onboard perished — especially passengers, women, children, and Swedes.
The official report points to a mechanical failure. Yet questions remain, and theories continue to circulate. What no one disputes: on that stormy night, the Baltic waters rushed in, and the Estonia was gone in less than an hour.
My aim here was not only to present data. It was to transform it into something more. Into memory.
Passenger lists, survival rates, nationalities, dimensions — these are numbers. But once shaped into visuals, they become a story. A reminder.
If this work helped you discover the Estonia, understand it differently, or simply not forget it, then this data art has done its job.
Here is the full Lumadataart MS Estonia visualization.